Page no: V97a
Explanation |
Videos and Pics |
||||||||||||||||||||||||||||||||||||||||||||||||||||||
Word with PcitureWord Image
|
|||||||||||||||||||||||||||||||||||||||||||||||||||||||
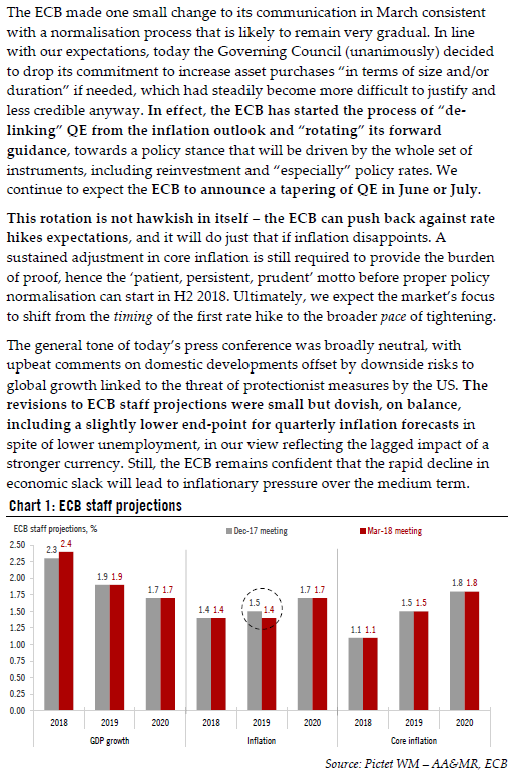
Original PDFIn the original PDF as we can see on the screenshot on the right, the graph is after all 3 paragraphs. |
Original PDF |
||||||||||||||||||||||||||||||||||||||||||||||||||||||
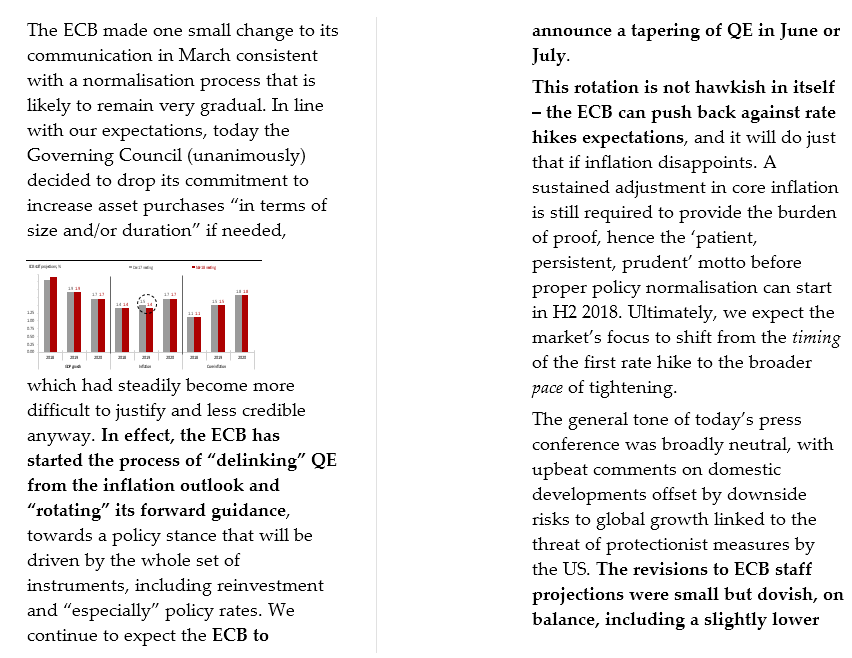
Step1: Import PDF into WordWhen we import the PDF into Word, we can see on the right side that the graph is imported at the middle of the first paragraph. |
Imported PDF into Word |
||||||||||||||||||||||||||||||||||||||||||||||||||||||
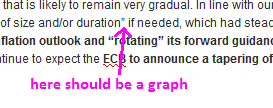
Step2: Import Word to WordPressWhen we import Word into WordPress, there is no graph/image. I have indicated where the graph should exist. Link to Page where it got imported: Link There is some sort of problem in plugin. Imports only text, without graphs/images.
|
Imported Word into Wordpress |
||||||||||||||||||||||||||||||||||||||||||||||||||||||
Step3: Make Tiny Table with ExcelSimply we select the cells which we want to copy and paste it into the WP page. |
|
See more for


