Chandler Post
Additional checks:
- Check Chandler HTML if <div …> tinytable </div> —-> move </div> before the tiny table: <div..> </div> tiny table
|

|
EUR/CHF and USD/CHF
We start the post with a text for EUR/CHF and USD/CHF
Taking this graph from Markets.ft.com.
Models for writing text on EUR/CHF
Higher:
+ The Euro has risen by 0.06% to 1.0922 CHF.
– The Euro has fallen by 0.06% to 1.0922 CHF.
+ The euro is up by 0.06% to 1.0922 CHF
+ The euro is higher at 1.0922 CHF (+0.06%).
Lower:
– The euro is lower at 1.0922 (-0.06%)
+ The euro has appreciated by 0.06% to 1.0922 CHF.
– The euro has depreciated by 0.06% to 1.0922 CHF.
—> Choose one !! |
EUR/CHF and USD/CHF May 01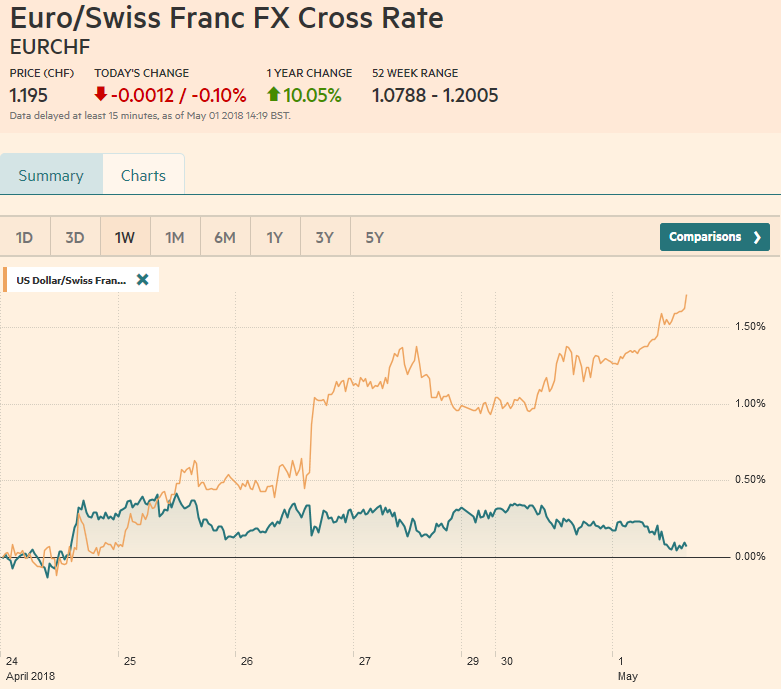 - Click to enlarge No video upload need, this does not need a video explanation |
Old:
Featured Image: Dukascopy
Movers and Shakers (Dukascopy)
Movers and Shakers BAD: BAD
GOOD:
the videos |
We do not use them anymore.
Reasons:
- They are often late, so we put them only on the next day.
- Inconsistencies between Investing.com FX and Dukascopy –> not some rates
- Manual effort to find correct screens
|
Introduction Comments
George Dorgan
- George writes text for Swiss Franc, or [GDCHF]
- Swiss Franc: Add EUR/CHF graph from investing.com every day. http://www.investing.com/currencies/eur-chf click on 5 and choose the lowest price with the cursor (here 30.6. 23:45 MET) if we have Swiss economic data http://www.investing.com/economic-calendar/trade-balance-288
|
. |
Seeking Alpha – Stopped
- copy excerpt from seeking alpha into
- The excerpts are short without verbs. Simeon should add some verbs.
|
|
Comment from Swiss Franc Forecast
Copy into Daily FX
Load it at 18.30, after Daily FX.
Snippet for comment about Swiss Franc and GBP
|
(January 17, 2017)
|
FX Rates Graphs
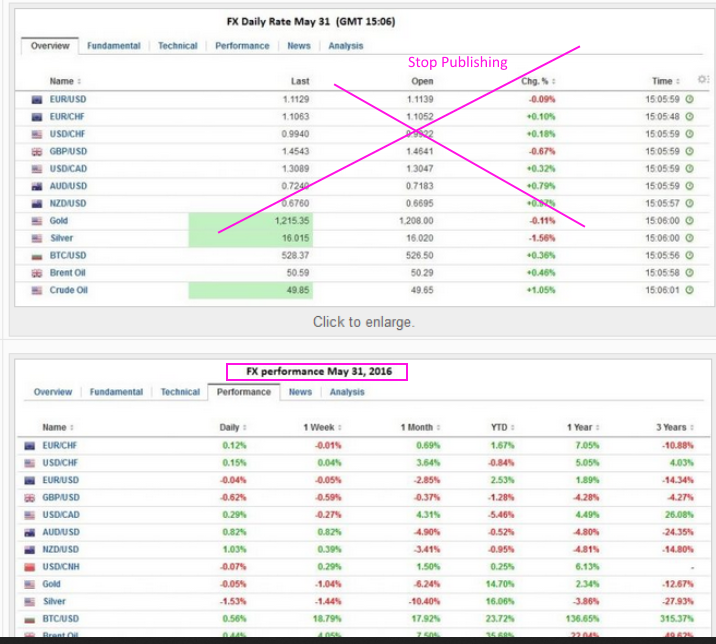
– Must contain many FX words like Dollar, Euro, Sterling, Yen, Australian Dollar, then you use the graphs FX Overview and FX Performance
18 BG time: Upload from investing.com
- Login with investing.com/
- Copy from Major portfolio Overview and add title
- Copy from Major portfolio Performance and add title
Copy graph for FX Overview at GMT 15.00
Copy graph for FX Performance at GMT 15.00 |
|
SNBCHF Currency Pairs
We need to take a photo of the right currency pairs. For example in this video, we don’t like USD/EUR. The right pair in this situation is EUR/USD. Need to focus more before taking a photo for any currency pairs. |
|
Wrong Order
into graph see pictures |
USDEUR Wrong Order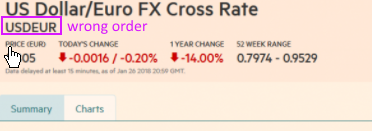 - Click to enlarge |
Chapters: Text
| Chapter Name |
Typical Keywords |
Graph when the Chapter is big |
| United Kingdom (we used Brexit because of news) |
Brexit, UK, Bank of England, BoE, Theresa May |
GBP/USD
(or economic graphs) |
| EuroZone |
Germany, France, European, Euro, European Central Bank (ECB) |
EUR/USD
(or economic graphs) |
| Japan |
Yen, Bank of Japan (BoJ) |
USD/JPY
(or economic graphs) |
| Canada |
Canada Dollar, Loonie, Canada, BoC, Bank of Canada (BoC) |
Only economic graphs |
| United States |
US |
Only economic graphs |
| Federal Reserve |
Fed, Federal Reserve |
Only economic graphs |
|
Chapter name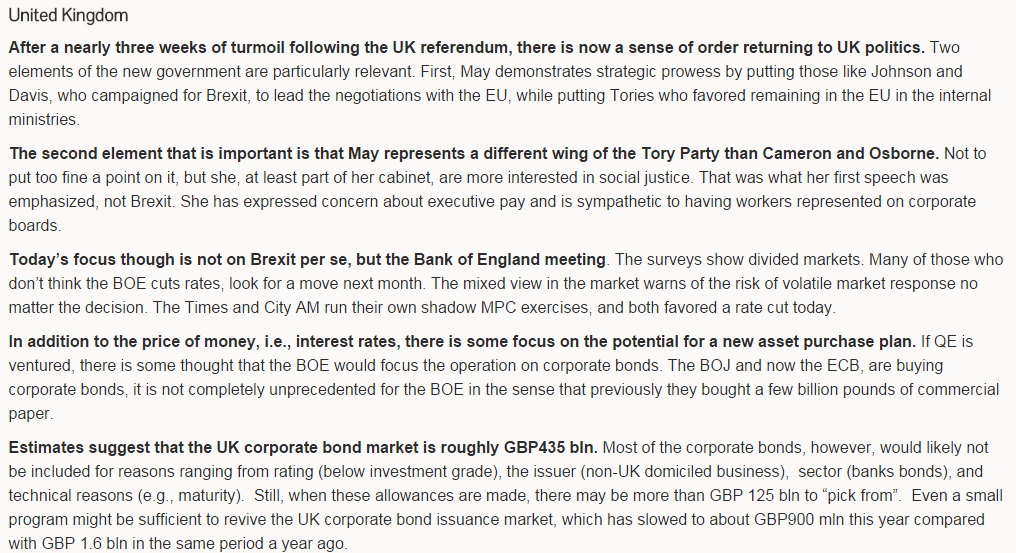 - Click to enlarge |
Chapter: Federal Reserve
The chapter is name is Federal Reserve or Fed.
You may put a graph like Producer Prices, but only if he does not speak about producer prices. |
 . |
Economic Graphs
See the detailed page for Economic Graphs and Tags (R62)
- Economic Data: You find it, based on the Economic Tags
- Economic Data: Create Screenshot with latest data “actual, forecast” text in the image (see screenshot)
- Economic data “source Investing.com”, link to the data page e.g.
- Economic data: Take YoY data if it exists
- Use graph that goes back 2011 (5 years)
- Remove old Daily FX from Featured Posts
|
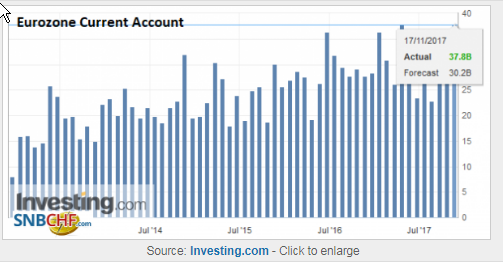 . |
Title into Economic Graph
The video explains
- Copy Title of Economic Data into the image
- Needed for Google image searchg
- Use Paint Net or similar
- Do not write the month into title
- So media title and image title is different
|
(March 09, 2017)
|
End Text
- “Graphs and additional information on Swiss Franc by the snbchf team. ” on the bottom of the post (in bold, italic)
|
|
Formatting
Text in tiny tables
Put more text into tiny tables
Currently you write more text outside the tiny tables. I prefer that more text is inside the table. This should be the standard layout.
But not too much!
Not too much text so that the text part is far longer than the graph part. |
Daily FX Rates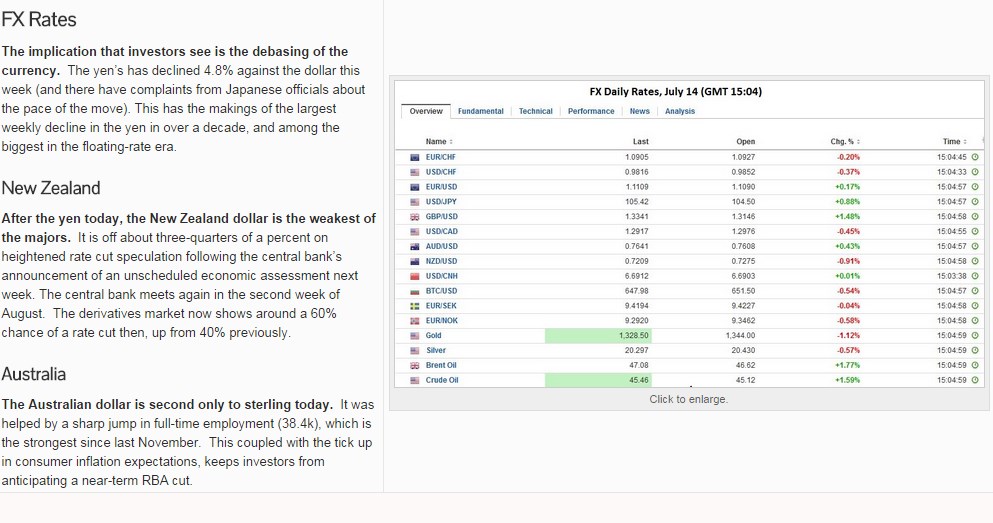 - Click to enlarge |
| Text and Graph inline
5) Do not write the graph name as Chapter Name to the left side, when he speaks about something else.
This is a little difficult, because you must read the text. The key word PPI was in the previous chapter. |
Good Example: Text and Graph Inline - Click to enlarge |


