Page no: R65
Explanation |
Video and Pics
|
Posts About InflationInflation: Always use these graphs United Kingdom, when he speaks of BoE Bank ofEngland |
US Core PCE Index Archive US Core PCE Index Archive - Click to enlarge UK CPI Archive UK CPI Archive - Click to enlarge |
FX Daily: Title and Tags: no MoM, only existing tagsYou must use only existing tags! Exception for MoM: U.S. Core Durable Goods Orders
|
Daily FX Graph Japan Consumer Price Index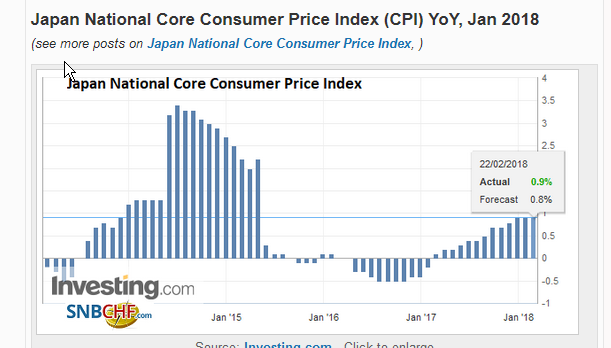 - Click to enlarge |
Switzerland Employment GraphDaily FX Graph Switzerland Employment Level
|
Daily FX Switzerland Employment Level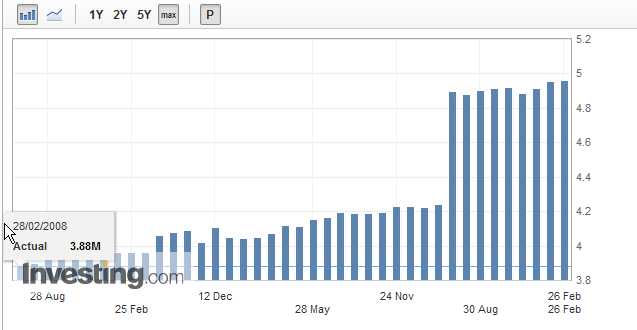 - Click to enlarge |
Tags for Economic Graphs: Use ONLY Existing Tags, no new tagsPrinciple: We will use always the same tag, in the same format.
Daily FX -> Country Tags Examples – Japan Money Supply Daily FX –> Central Bank tags Examples – Bank of Japan Assets Market Index |
|
Tag Archives and Graphs not from Investing
|
|
Decide which economic graphs to publish
|
|
Define words in the tagsWe write a description for all major tags Example: http://fxwords.com/c/consumer-price-index-cpi-switzerland.html |
|
SNBCHF Currency PairsWe need to take a photo of the right currency pairs. For example in this video, we don’t like USD/EUR. The right pair in this situation is EUR/USD. Need to focus more before taking a photo for any currency pairs. |
|
Wrong Orderinto graph |
USDEUR Wrong Order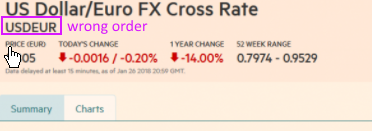 - Click to enlarge |
Correct Month of Daily FXFinal CPI and PMI come at beginning of next month Flash for CPI, PMI April –> April 23 (same month) Retail Sales often late: last month GDP Q1, never month, Always use quarter |
Text is not same as graph: Change date in media title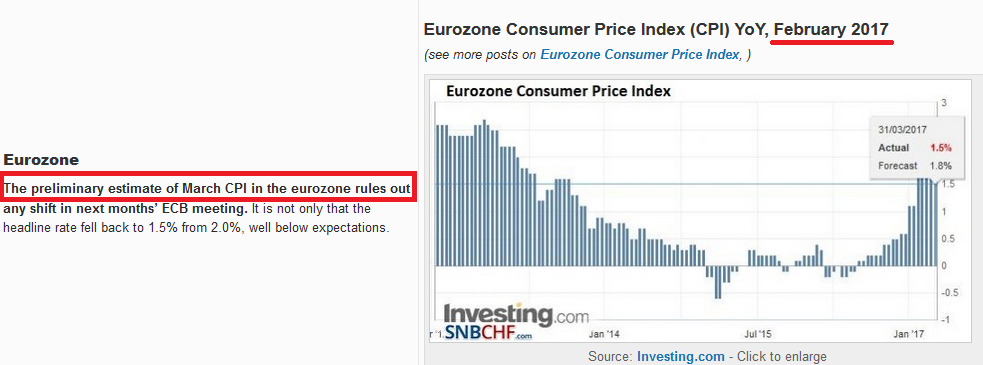 - Click to enlarge |
| The video explains:
: The tag archive for economic tags did not contain all posts.
Reason: The team did not copy the tags from the graphs into the posts. Use the function “copy tags from graphs into posts” regularly. |
(May 03, 2017) |
See more for